
Chapter 10: Advanced Callbacks
Contents
Chapter 10: Advanced Callbacks
What you will learn
You have already learned about callbacks in chapter 4. Now, it is time to enhance our skill set and deal with more advanced callbacks.
Learning Intentions
Multiple Outputs and Inputs
Buttons in callbacks
Callback context to determine triggers
States
By the end of this chapter you will know how to build this app:
See the code
# Import packages
from dash import Dash, dash_table, dcc, html, Input, Output, State
import dash_bootstrap_components as dbc
import plotly.express as px

# Setup data
df = px.data.gapminder()
dropdown_list = df['country'].unique()

# Initialise the App
app = Dash(__name__, external_stylesheets=[dbc.themes.BOOTSTRAP])

# Create app components
markdown = dcc.Markdown(id='our-markdown', children='# My first app')
dropdown = dcc.Dropdown(id='our-dropdown', options=dropdown_list, value=dropdown_list[0])
radio = dcc.RadioItems(id='our-radio', options=['line', 'scatter'], value='line')
button = html.Button(id='our-button', children='Update data', n_clicks=0)
data_table = dash_table.DataTable(id='our-data-table', page_size=10)

# App Layout
app.layout = dbc.Container(
    [
        dbc.Row(dbc.Col(markdown)),
        dbc.Row(
            [
                dbc.Col(dropdown, width=3),
                dbc.Col(radio, width=3),
                dbc.Col(button, width=3)
            ]
        ),
        dbc.Row(dbc.Col(dcc.Graph(id='our-figure'))),
        dbc.Row(dbc.Col(data_table))
    ]
)


# Configure callbacks
@app.callback(
    Output(component_id='our-figure', component_property='figure'),
    Output(component_id='our-data-table', component_property='data'),
    Input(component_id='our-button', component_property='n_clicks'),
    State(component_id='our-dropdown', component_property='value'),
    State(component_id='our-radio', component_property='value'),
)
def update_graph(n_clicks, value_dropdown, value_radio):
    if n_clicks >= 0:
        df_sub = df[df['country'].isin([value_dropdown])]
        data = df_sub.to_dict('records')

        if value_radio == 'scatter':
            fig = px.scatter(
                df_sub,
                x='year',
                y='lifeExp',
                color='country',
                symbol='continent',
                title='PX {} plot'.format(value_radio),
                template='plotly_white'
            )
        else:
            fig = px.line(
                df_sub,
                x='year',
                y='lifeExp',
                color='country',
                symbol='continent',
                title='PX {} plot'.format(value_radio),
                template='plotly_white'
            )

    return fig, data


# Run the App
if __name__ == '__main__':
    app.run_server()
10.1 Multiple Outputs and Inputs
You might want to have a graph that is linked to more than one component (multiple Inputs) that updates different dimensions of your graph. If you think the other way around, you might want to have several graphs (multiple Outputs) that are updated by the same component. Here is where multiple outputs and inputs come into play.
Let us see multiple Inputs in action first. Let’s build an app that has a dropdown and radio buttons, both of which will modify the graph. The dropdown will be used to select a single country out of all the countries covered in the gapminder data set. The radio buttons will be used to build either a line chart or a scatter plot.
Now, since we are using 2 Inputs in the callback decorator, we have 2 component properties. Each component property must be represented as callback function arguments (in this example value_dropdown and value_radio). Also, make sure that the order in which you write the component properties reflects the order of the function arguments: the first Input component property is tied to the first function argument.
# Import packages
from dash import Dash, dcc, Input, Output
import dash_bootstrap_components as dbc
import plotly.express as px

# Setup data
df = px.data.gapminder()
dropdown_list = df['country'].unique()

# Initialise the App
app = Dash(__name__, external_stylesheets=[dbc.themes.BOOTSTRAP])

# Create app components
dropdown = dcc.Dropdown(id='our-dropdown', options=dropdown_list, value=dropdown_list[0])
radio = dcc.RadioItems(id='our-radio', options=['line', 'scatter'], value='line')

# App Layout
app.layout = dbc.Container(
    [
        dbc.Row(
            [
                dbc.Col(dropdown, width=3),
                dbc.Col(radio, width=1)
            ]
        ),
        dbc.Row(dbc.Col(dcc.Graph(id='our-figure'))),
    ]
)


# Configure callbacks
@app.callback(
    Output(component_id='our-figure', component_property='figure'),
    Input(component_id='our-dropdown', component_property='value'),
    Input(component_id='our-radio', component_property='value'),
)
def update_graph(value_dropdown, value_radio):
    df_sub = df[df['country'].isin([value_dropdown])]

    if value_radio == 'scatter':
        fig = px.scatter(
            df_sub,
            x='year',
            y='lifeExp',
            color='country',
            symbol='continent',
            title='PX {} plot'.format(value_radio),
            template='plotly_white'
        )
    else:
        fig = px.line(
            df_sub,
            x='year',
            y='lifeExp',
            color='country',
            symbol='continent',
            title='PX {} plot'.format(value_radio),
            template='plotly_white'
        )

    return fig


# Run the App
if __name__ == '__main__':
    app.run_server()
Similarly, we are able to define multiple Outputs in one callback. For this, let us take another example, where we want to trigger a graph and a table at the same time through one dropdown. Again, we want to be able to select one specific country of interest to us, whose data then get displayed within the graph and the table.
Because we are using multiple outputs we need to add them as component properties in the callback decorator as well as return the same number of variables in the callback function (in this example fig and data separated by a comma). Also, make sure that the order you enter the variables reflects the order of the component properties: first component property is tied to the first returned variable.
# Import packages
from dash import Dash, dash_table, dcc, Input, Output
import dash_bootstrap_components as dbc
import plotly.express as px

# Setup data
df = px.data.gapminder()
dropdown_list = df['country'].unique()

# Initialise the App
app = Dash(__name__, external_stylesheets=[dbc.themes.BOOTSTRAP])

# Create app components
dropdown = dcc.Dropdown(id='our-dropdown', options=dropdown_list, value=dropdown_list[0])
data_table = dash_table.DataTable(id='our-data-table', page_size=10)
graph = dcc.Graph(id='our-figure')

# App Layout
app.layout = dbc.Container(
    [
        dbc.Row(dbc.Col(dropdown, width=6)),
        dbc.Row(dbc.Col(graph)),
        dbc.Row(dbc.Col(data_table)),
    ]
)


# Configure callbacks
@app.callback(
    Output(component_id='our-figure', component_property='figure'),
    Output(component_id='our-data-table', component_property='data'),
    Input(component_id='our-dropdown', component_property='value'),
)
def update_graph(value_dropdown):
    df_sub = df[df['country'].isin([value_dropdown])]

    fig = px.line(
        df_sub,
        x='year',
        y='lifeExp',
        color='country',
        symbol='continent',
        title='PX line plot',
        template='plotly_white'
    )

    data = df_sub.to_dict('records')
    return fig, data


# Run the App
if __name__ == '__main__':
    app.run_server()
10.2 Buttons within a callback
Now, that you know how to implement multiple inputs and outputs, it’s worth taking a closer look at buttons and how to approach them within callbacks. Aside from the children and id properties, buttons come with a property called n_clicks, which represents the number of times that the button has been clicked. The n_clicks property therefore always is a non-negative integer. You would typically use this property to trigger a callback and return output components whenever the button is clicked. In the example below, we change the title of our app depending on if, and how often, the button has been clicked.
# Import packages
from dash import Dash, dcc, html, Input, Output
import dash_bootstrap_components as dbc

# Initialise the App
app = Dash(__name__, external_stylesheets=[dbc.themes.BOOTSTRAP])

# Create app components
markdown = dcc.Markdown(id='our-markdown')
button = html.Button(id='our-button', children='Update title', n_clicks=0)

# App Layout
app.layout = dbc.Container(
    [
        dbc.Row(dbc.Col(markdown)),
        dbc.Row(dbc.Col(button))
    ]
)


# Configure callbacks
@app.callback(
    Output(component_id='our-markdown', component_property='children'),
    Input(component_id='our-button', component_property='n_clicks'),
)
def update_title(n_clicks):
    if n_clicks == 0:
        title = 'My first app. The button has not been clicked yet.'
    else:
        title = 'My first app with a button that I have clicked {} times.'.format(n_clicks)
    return title


# Run the App
if __name__ == '__main__':
    app.run_server()
To give you more flexibility programming your future apps, let us see how to reset the n_clicks component property of one button through another button. For this, we adjust the above example by adding a second button. Whenever the second button is clicked, the component property n_clicks of the first button will be reset to 0.
# Import packages
from dash import Dash, dcc, html, Input, Output
import dash_bootstrap_components as dbc

# Initialise the App
app = Dash(__name__, external_stylesheets=[dbc.themes.BOOTSTRAP])

# Create app components
markdown = dcc.Markdown(id='our-markdown')
button = html.Button(id='our-button', children='Update title', n_clicks=0)
button_reset = html.Button(id='reset-button', children='Reset', n_clicks=0)

# App Layout
app.layout = dbc.Container(
    [
        dbc.Row(dbc.Col(markdown)),
        dbc.Row(
            [
                dbc.Col(button, width=2),
                dbc.Col(button_reset, width=2)
            ]
        )
    ]
)


# Configure callbacks
@app.callback(
    Output(component_id='our-markdown', component_property='children'),
    Input(component_id='our-button', component_property='n_clicks'),
)
def update_title(n_clicks):
    if n_clicks == 0:
        title = 'My first app. The button has not been clicked yet.'
    else:
        title = 'My first app with a button, that I have clicked {} times.'.format(n_clicks)
    return title


@app.callback(
    Output(component_id='our-button', component_property='n_clicks'),
    Input(component_id='reset-button', component_property='n_clicks'),
)
def update_title(n_clicks):
    if n_clicks >= 0:
        clicks = 0
    return clicks


# Run the App
if __name__ == '__main__':
    app.run_server()
10.3 Callback Context - determine which Input fired
In the previous example each button belonged to a separate callback. However, eventually you might want to create apps where multiple buttons exist in the same callback as two Inputs. For example, one button would create a scatter plot, whereas the other button would reset that same graph. Given that these two actions are mutually exclusive, we need to determine which button triggered the callback, thereby allowing the right action to take place. For this, there exists a global variable called the Dash callback context (dash.ctx).
from dash import Dash, Input, Output, html, dcc, ctx
import plotly.express as px
import plotly.graph_objects as go
import dash_bootstrap_components as dbc

#Initialise the App
app = Dash(__name__, external_stylesheets=[dbc.themes.BOOTSTRAP])

# App Layout
app.layout = dbc.Container([
    html.Button('Draw Graph', id='draw'),
    html.Button('Reset Graph', id='reset'),
    dcc.Graph(id='graph')
])


# Configure callbacks
@app.callback(
    Output('graph', 'figure'),
    Input(component_id='reset', component_property='n_clicks'),
    Input(component_id='draw', component_property='n_clicks'),
    prevent_initial_call=True
)
def update_graph(b1, b2):
    triggered_id = ctx.triggered_id
    print(triggered_id)

    if triggered_id == 'reset':
        return go.Figure()  # empty figure

    elif triggered_id == 'draw':
        df = px.data.iris()
        return px.scatter(df, x=df.columns[0], y=df.columns[1])


# Run the App
if __name__ == '__main__':
    app.run_server()
Notice in the code above that we imported ctx from dash. Then, we used its property triggered_id inside the callback function to determine the ID of the button that was triggered.
Another useful property of the callback context is the triggered_prop_ids. This is a dictionary of the component IDs and props that triggered the callback. It is beneficial to use when multiple properties of the same component (ID) can trigger the callback. For example, let’s build a scatter plot and display on the page data generated from the selectedData and the clickData properties of the graph.
Run the code and try to click on one of the scatter markers. Then, use the box tool to select a group of markers and see how the sentence changes.
import dash
from dash import Dash, Input, Output, html, dcc, ctx, no_update
import plotly.express as px
import plotly.graph_objects as go
import dash_bootstrap_components as dbc

#Initialise the App
app = Dash(__name__, external_stylesheets=[dbc.themes.BOOTSTRAP])

df = px.data.iris()
fig = px.scatter(df, x=df.columns[0], y=df.columns[1])

# App Layout
app.layout = dbc.Container([
    dcc.Markdown(id='content'),
    dcc.Graph(id='graph-id', figure=fig)
])


# Configure callbacks
@app.callback(
    Output('content', 'children'),
    Input(component_id='graph', component_property='selectedData'),
    Input(component_id='graph', component_property='clickData'),
    prevent_initial_call=True
)
def update_graph(selected, clicked):
    triggered_prop_id = ctx.triggered_prop_ids

    if 'graph.selectedData' in triggered_prop_id:
        if selected:
            return 'The x range of the selected data starts from {}'.format(selected['range']['x'][0])
        else:
            no_update

    elif 'graph.clickData' in triggered_prop_id:
        print(clicked)
        return 'The Sepal width of the clicked data is {}'.format(clicked['points'][0]['y'])


# Run the App
if __name__ == '__main__':
    app.run_server()
10.4 States
So far, we have seen how all Input components of an app trigger the callback. In certain situations it might be useful to wait for all the Inputs to update before the callback is actually triggered. For this purpose there is a third argument that can be used within the callback decorator, the State. The State argument is written in the same manner as the Input argument, but the difference is that the component property inside State will not trigger the callback.
Let us bring everything together in one final example. We will implement an app with a dropdown, radio items, and a button which will trigger the callback, thereby updating a graph and a DataTable. We only want to trigger the callback when the button is clicked. For this, we declare all arguments that should not trigger the callback (dropdown and radio buttons) as State arguments instead of Input arguments in the callback decorator.
Attention
Note that you need to import the state argument the same way we are importing the input and output arguments at the beginning of the code.
# Import packages
from dash import Dash, dash_table, dcc, html, Input, Output, State
import dash_bootstrap_components as dbc
import plotly.express as px

# Setup data
df = px.data.gapminder()
dropdown_list = df['country'].unique()

# Initialise the App
app = Dash(__name__, external_stylesheets=[dbc.themes.BOOTSTRAP])

# Create app components
markdown = dcc.Markdown(id='our-markdown', children='# My first app')
dropdown = dcc.Dropdown(id='our-dropdown', options=dropdown_list, value=dropdown_list[0])
radio = dcc.RadioItems(id='our-radio', options=['line', 'scatter'], value='line')
button = html.Button(id='our-button', children='Update data', n_clicks=0)
data_table = dash_table.DataTable(id='our-data-table', page_size=10)

# App Layout
app.layout = dbc.Container(
    [
        dbc.Row(dbc.Col(markdown)),
        dbc.Row(
            [
                dbc.Col(dropdown, width=3),
                dbc.Col(radio, width=3),
                dbc.Col(button, width=3)
            ]
        ),
        dbc.Row(dbc.Col(dcc.Graph(id='our-figure'))),
        dbc.Row(dbc.Col(data_table))
    ]
)


# Configure callbacks
@app.callback(
    Output(component_id='our-figure', component_property='figure'),
    Output(component_id='our-data-table', component_property='data'),
    Input(component_id='our-button', component_property='n_clicks'),
    State(component_id='our-dropdown', component_property='value'),
    State(component_id='our-radio', component_property='value'),
)
def update_graph(n_clicks, value_dropdown, value_radio):
    if n_clicks >= 0:
        df_sub = df[df['country'].isin([value_dropdown])]
        data = df_sub.to_dict('records')

        if value_radio == 'scatter':
            fig = px.scatter(
                df_sub,
                x='year',
                y='lifeExp',
                color='country',
                symbol='continent',
                title='PX {} plot'.format(value_radio),
                template='plotly_white'
            )
        else:
            fig = px.line(
                df_sub,
                x='year',
                y='lifeExp',
                color='country',
                symbol='continent',
                title='PX {} plot'.format(value_radio),
                template='plotly_white'
            )

    return fig, data


# Run the App
if __name__ == '__main__':
    app.run_server()
Exercises
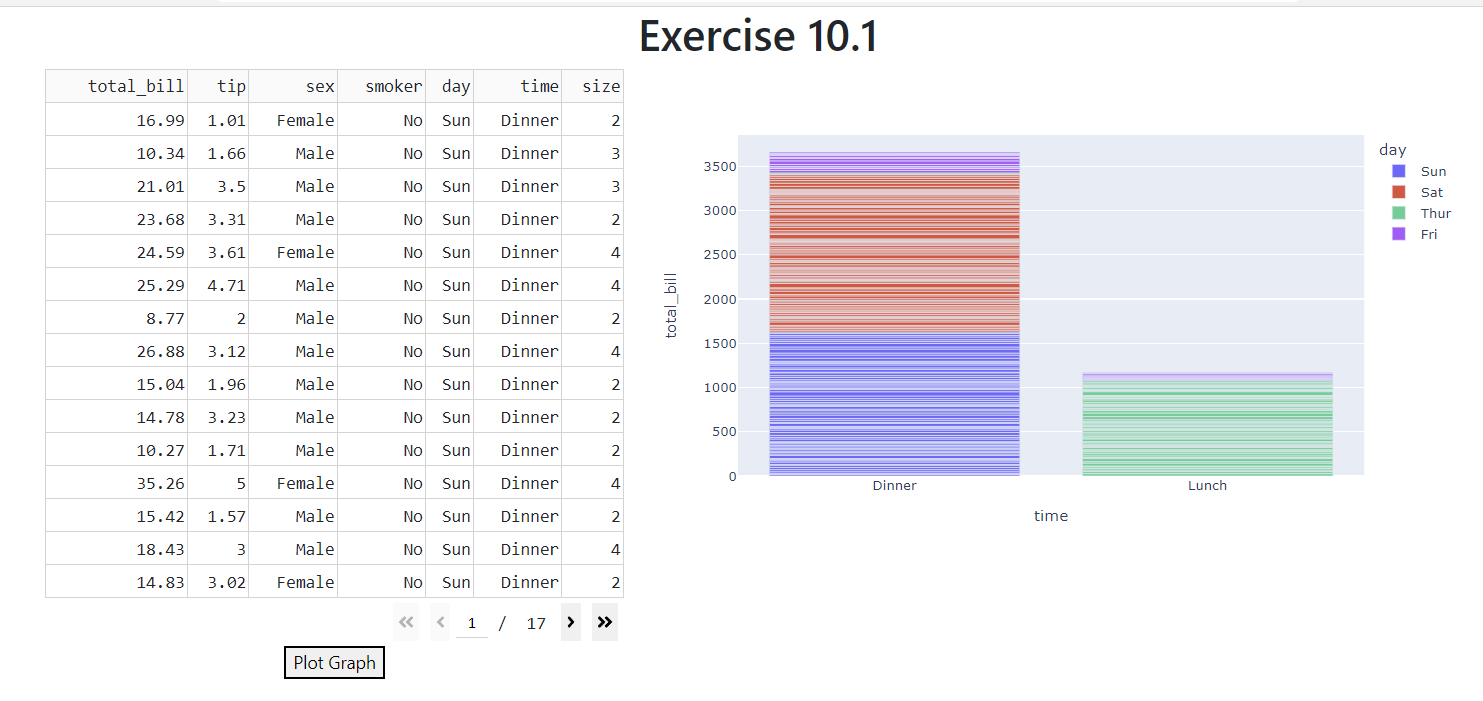
(1) Build an app composed of a title, a DataTable, a button and a bar chart.
The DataTable should display the
px.data.tips()Plotly data set. The table should be editable and display 15 rows per page.Create a callback that takes the
n_clicksof the button and thedataprop of the DataTable, and converts the data to a dataframe calleddff.Use the newly created
dffto create a bar chart that plots thetimeon the x-axis, thetotal_billon the y-axis and thedayas the color attribute.The bar chart should be generated only when pressing on the button.
Run the app and try to change a few of the DataTable cell data and click the button to see an updated graph.
See Solution
# Import packages
from dash import Dash, dash_table, dcc, html, Input, Output, State
import dash_bootstrap_components as dbc
import plotly.express as px
import pandas as pd

# Setup data
df = px.data.tips()

# Initialise the App
app = Dash(__name__, external_stylesheets=[dbc.themes.BOOTSTRAP])

# Create app components
markdown = dcc.Markdown(id='our-markdown', children='# Exercise 10.1', style={'textAlign': 'center'})
button = html.Button(id='draw', children='Plot Graph', n_clicks=0)
data_table = dash_table.DataTable(
                id='input-data',
                data = df.to_dict('records'),
                columns=[{'name': i, 'id': i} for i in df.columns],
                editable=True,
                page_size=15,
                style_table={'overflowX': 'auto'}
)
graph = dcc.Graph(id='chart')

# App Layout
app.layout = dbc.Container(
    [
        dbc.Row(dbc.Col(markdown)),
        dbc.Row(
            [
                dbc.Col(data_table, width=5),
                dbc.Col(graph, width=7)
            ]
        ),
        dbc.Row(
            [
                dbc.Col(button, width=5, style={'textAlign': 'center'}),
            ]
        )
    ]
)

# Configure callbacks
@app.callback(
    Output(component_id='chart', component_property='figure'),
    Input(component_id='draw', component_property='n_clicks'),
    State(component_id='input-data', component_property='data'),
)
def plot_table(n_clicks, table_data):
    dff = pd.DataFrame(table_data)
    fig = px.bar(dff, x='time', y='total_bill', color='day')
    return fig

# Run the App
if __name__ == '__main__':
    app.run_server()
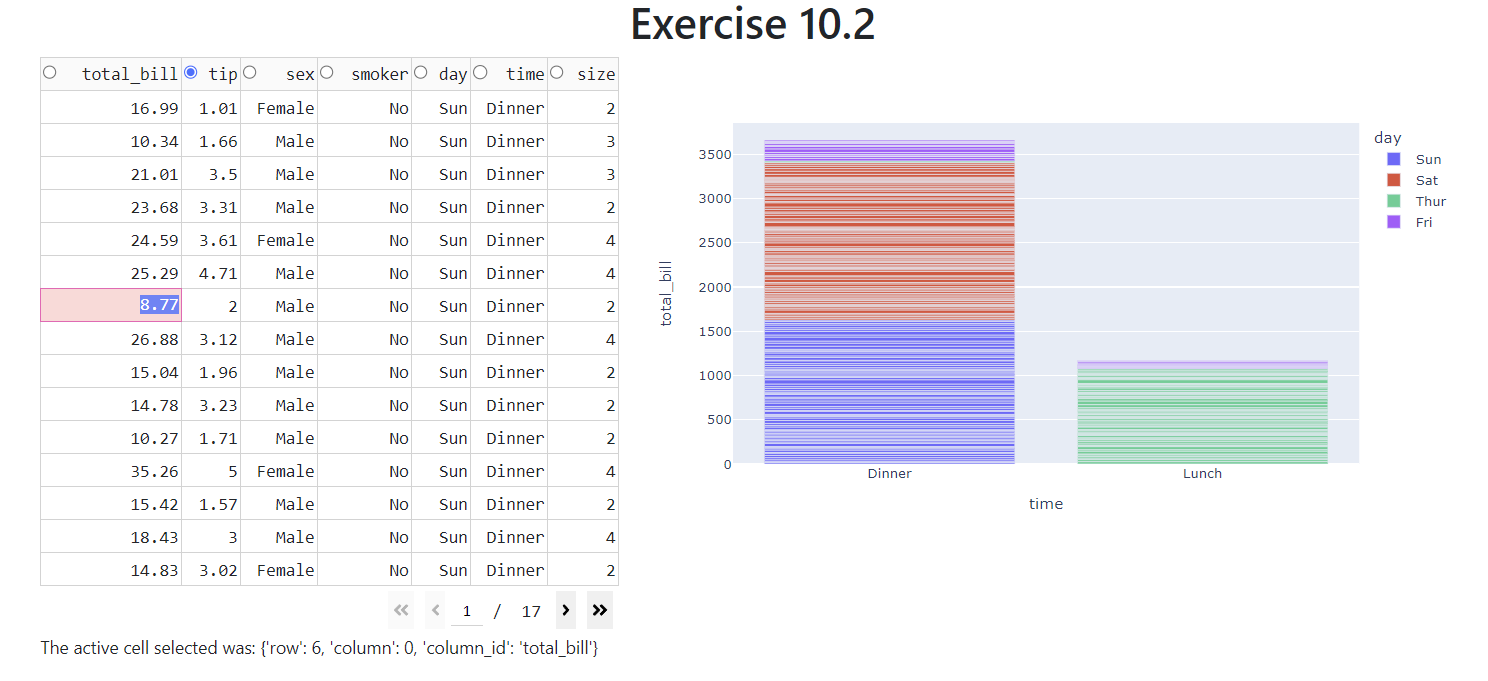
(2) Modify the app in exercise 1:
Add a
column_selectableandselected_columnsprops to the DataTable, and assign['tip']to the selected column.Replace the button with an empty
html.Div()and include thechildrenof that Div as the second Output component in the callback.The callback should have two Outputs (Div and Graph), and three Inputs that belong to the DataTable, whose component properties are:
active_cell,selected_columns, anddata.Keep the same callback function content from example 1. But add to it the following content, based on the second example from chapter 10.3 callback context:
if
selected_columnsis intriggered_prop_idcreate a message the displays the column selected dataif
active_cellis intriggered_prop_idcreate a message the displays the active cell dataelse create a message that says “Nothing selected yet.”
Return both figure and message at the end.
Run the app and see how the message changes based on the column or cell selected.
See Solution
# Import packages
from dash import Dash, dash_table, dcc, html, Input, Output, State, ctx
import dash_bootstrap_components as dbc
import plotly.express as px
import pandas as pd

# Setup data
df = px.data.tips()

# Initialise the App
app = Dash(__name__, external_stylesheets=[dbc.themes.BOOTSTRAP])

# Create app components
markdown = dcc.Markdown(id='our-markdown', children='# Exercise 10.2', style={'textAlign': 'center'})
data_table = dash_table.DataTable(
                id='input-data',
                data=df.to_dict('records'),
                columns=[{'name': i, 'id': i, 'selectable':True} for i in df.columns],
                editable=True,
                page_size=15,
                style_table={'overflowX': 'auto'},
                column_selectable="single",
                selected_columns=['tip'],
)
graph = dcc.Graph(id='chart')

# App Layout
app.layout = dbc.Container(
    [
        dbc.Row(dbc.Col(markdown)),
        dbc.Row(
            [
                dbc.Col(data_table, width=5),
                dbc.Col(graph, width=7)
            ]
        ),
        dbc.Row([
            dbc.Col([html.Div(id='content')])
        ])
    ]
)

# Configure callbacks
@app.callback(
    Output(component_id='chart', component_property='figure'),
    Output(component_id='content', component_property='children'),
    Input(component_id='input-data', component_property='active_cell'),
    Input(component_id='input-data', component_property='selected_columns'),
    Input(component_id='input-data', component_property='data'),
)
def plot_table(cell, col, table_data):
    triggered_prop_id = ctx.triggered_prop_ids
    if 'input-data.selected_columns' in triggered_prop_id:
        message = f"The column selected was: {col}"
    elif 'input-data.active_cell' in triggered_prop_id:
        message = f"The active cell selected was: {cell}"
    else:
        message = "Nothing selected yet."

    dff = pd.DataFrame(table_data)
    fig = px.bar(dff, x='time', y='total_bill', color='day')
    return fig, message


# Run the App
if __name__ == '__main__':
    app.run_server()
Summary
We have learned about how to link multiple input components with multiple output components. Furthermore, you now know how to use the button inside the callback and how to identify which Input triggered the callback with callback context. Additionally, with the understanding of the State argument, you are now well-equipped to build even more complex, fully interactive apps.
In the next chapter you will learn about additional components that can be used to enhance your Dash app.