
Chapter 7: Wrangling Data
Contents
Chapter 7: Wrangling Data
What you will learn
Data wrangling is the processing of raw data into a useable form. In this chapter we will go over data cleaning and filtering techniques to prepare the data for use in our dashboards.
What you will learn
common data exploration methods
How to clean data
How to filter data
Additional learning resources
7.1 Exploring Data
One of the most effective ways of exploring a data set is by using the pandas library. Pandas is an open source data analysis and manipulation tool, written in Python. Before you start, remember to pip install pandas in the terminal if you haven’t done so yet. Let’s review a few common pandas functions for data exploration.
Head
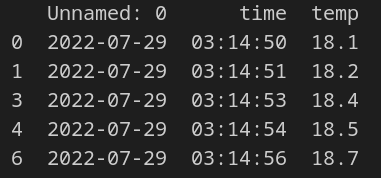
Commonly, after the data is imported, you would use the head command to see the top 5 rows of data:
import pandas as pd

url = 'https://raw.githubusercontent.com/open-resources/dash_curriculum/main/tutorial/part2/ch7_files/temp_data.csv'
raw_data = pd.read_csv(url)

print(raw_data.head())
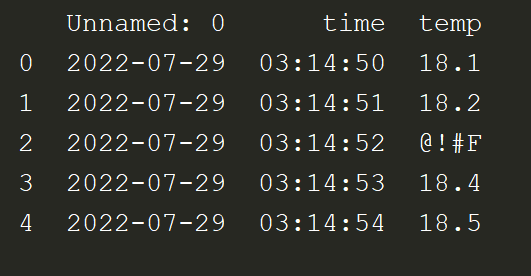
We see that this is time-series data which contains timestamped temperature readings. The first column is Unnamed: 0 because the linked csv file does not have a column name for that column.
Shape
shape is typically used to learn more about he dimensions of the data.
import pandas as pd
url = 'https://raw.githubusercontent.com/open-resources/dash_curriculum/main/tutorial/part2/ch7_files/temp_data.csv'
raw_data = pd.read_csv(url)
print(raw_data.head())
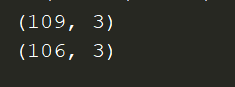
print(raw_data.shape)
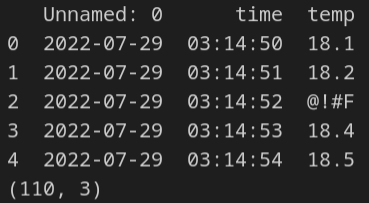
110 represents the number of rows, while 3 reflects the number of columns in the dataframe.
Info
The Pandas info method will return information on the dataframe such as:
data types
column names
memory usage
import pandas as pd

url = 'https://raw.githubusercontent.com/open-resources/dash_curriculum/main/tutorial/part2/ch7_files/temp_data.csv'
raw_data = pd.read_csv(url)

print(raw_data.info())
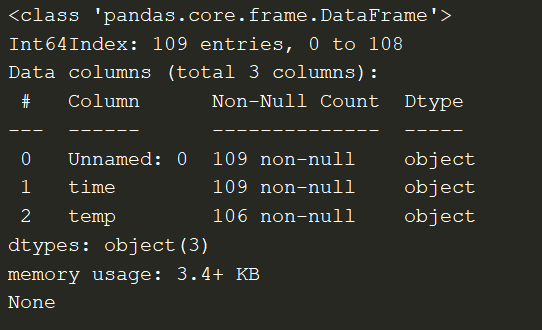
You see from the image above that the temp column has 106 non-null values, which means that 3 values are null. If you look carefully at the csv sheet, you would see that the data has 3 rows with no values in the temp column.
Describe
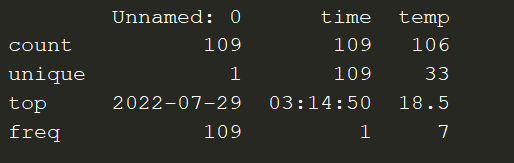
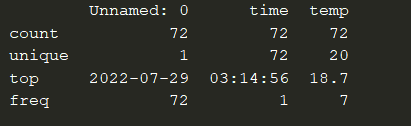
The Pandas describe method will return statistics on the dataframe such as:
min/max
unique values
count of non-null values in column
import pandas as pd

url = 'https://raw.githubusercontent.com/open-resources/dash_curriculum/main/tutorial/part2/ch7_files/temp_data.csv'
raw_data = pd.read_csv(url)

print(raw_data.describe())
7.2 Cleaning Data
Dropna
By exploring the datafarme in the section above, we saw that 3 of the values are null. Because there are only 3 values and because temperature values don’t vary significantly, let’s remove those rows with the missing values under the temp column. We’ll use the dropna for this task.
import pandas as pd

url = 'https://raw.githubusercontent.com/open-resources/dash_curriculum/main/tutorial/part2/ch7_files/temp_data.csv'
raw_data = pd.read_csv(url)

print(raw_data.shape)

raw_data.dropna(axis=0,inplace=True)

print(raw_data.shape)
There are now 3 fewer rows after droping the null value rows.
Iterrows and Try-Except
There are several non-numeric values that we’d like to drop from the dataframe as well. First, we need to iterate through each row in the dataframe with iterrows(). Then we’ll use Python’s try-expect logic to test if the row has a valid float data type. If it does not have a valid float data type, we will use dropna to remove that row:
import pandas as pd
url = 'https://raw.githubusercontent.com/open-resources/dash_curriculum/main/tutorial/part2/ch7_files/temp_data.csv'
raw_data = pd.read_csv(url)
raw_data.dropna(axis=0, inplace=True)
for index, col in raw_data.iterrows():
try:
float(col[2]) # 'temp' column is index 2
except:
raw_data.drop(index, axis=0, inplace=True)
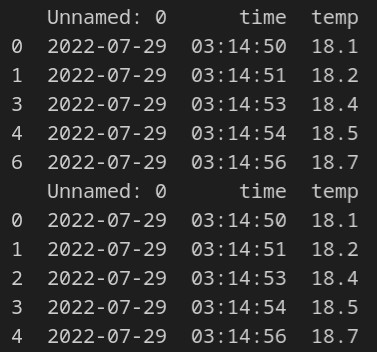
print(raw_data.head())
Notice from the image above that rows 2 and 5 were dropped. This is because neither of them had a float data type in the temp column.
Reset Index
Given that we’ve dropped a few rows, we see that the index of the dataframe is off. We’ll use the reset_index method to reset the index and drop the old index with drop=True:
import pandas as pd

url = 'https://raw.githubusercontent.com/open-resources/dash_curriculum/main/tutorial/part2/ch7_files/temp_data.csv'
raw_data = pd.read_csv(url)

raw_data.dropna(axis=0, inplace=True)

for index, col in raw_data.iterrows():
    try:
        float(col[2])  # 'temp' column is index 2
    except:
        raw_data.drop(index, axis=0, inplace=True)

print(raw_data.head())
raw_data.reset_index(drop=True, inplace=True)
print(raw_data.head())
7.3 Filter Data
In the next step of the data wrangling process, we will start filtering the data.
Filter by value & astype
Let’s filter the data for temperatures over 18.5C. Notice that we need to use the pandas method astype() to convert the temp column data to float type instead of the current string type.
import pandas as pd

url = 'https://raw.githubusercontent.com/open-resources/dash_curriculum/main/tutorial/part2/ch7_files/temp_data.csv'
raw_data = pd.read_csv(url)

raw_data.dropna(axis=0,inplace=True)

for index, col in raw_data.iterrows():
    try:
        float(col[2]) # 'temp' column is index 2
    except:
        raw_data.drop(index, axis=0, inplace=True)

raw_data.reset_index(drop=True, inplace=True)

print(raw_data.describe())
fltr_df = raw_data[raw_data['temp'].astype(float) > 18.5]
print(fltr_df.describe())
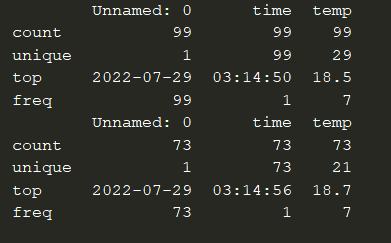
The result is a new dataframe (fltr_df) with 73 rows where the temp data is bigger than 18.5
Multiple logical operators
You might have noticed that the temp column has one row with the value of 300.2. This must be a mistake because temperatures on earth do not reach that level. Therefore, we should remove this row so it doesn’t contaminate the data. We can use logic operators, such as the & (AND) or the | (OR), to apply multiple conditions on the temp column.
import pandas as pd

url = 'https://raw.githubusercontent.com/open-resources/dash_curriculum/main/tutorial/part2/ch7_files/temp_data.csv'
raw_data = pd.read_csv(url)

raw_data.dropna(axis=0,inplace=True)

for index, col in raw_data.iterrows():
    try:
        float(col[2]) # 'temp' column is index 2
    except:
        raw_data.drop(index, axis=0, inplace=True)

raw_data.reset_index(drop=True, inplace=True)

fltr_df = raw_data[(raw_data['temp'].astype(float) > 18.5) & (raw_data['temp'].astype(float) < 50)]
print(fltr_df.describe())
iloc
The Pandas method iloc is used to filter data by index value. For example, if we wanted to limit the dataframe to the first 20 values, we could do the following:
import pandas as pd

url = 'https://raw.githubusercontent.com/open-resources/dash_curriculum/main/tutorial/part2/ch7_files/temp_data.csv'
raw_data = pd.read_csv(url)

raw_data.dropna(axis=0,inplace=True)

for index, col in raw_data.iterrows():
    try:
        float(col[2]) # 'temp' column is index 2
    except:
        raw_data.drop(index, axis=0, inplace=True)

raw_data.reset_index(drop=True, inplace=True)

fltr_df = raw_data[(raw_data['temp'].astype(float) > 18.5) & (raw_data['temp'].astype(float) < 50)]

first_20 = fltr_df.iloc[:20]
print(first_20.shape)

7.4 Other Resources
The pandas features we chose to highlight in this chapter should be enough to help you start building Dash apps. Nonetheless, if you would like to explore the many other features pandas has to offer, we’ve added a few resources we found helpful.
Summary
In this chapter we learned to explore, clean, and filter data to prepare it for use in Dash app. In the next chapter, we’ll dive into data visualization with the Plotly Express library.