Dashboard Layouts
Contents
Dashboard Layouts
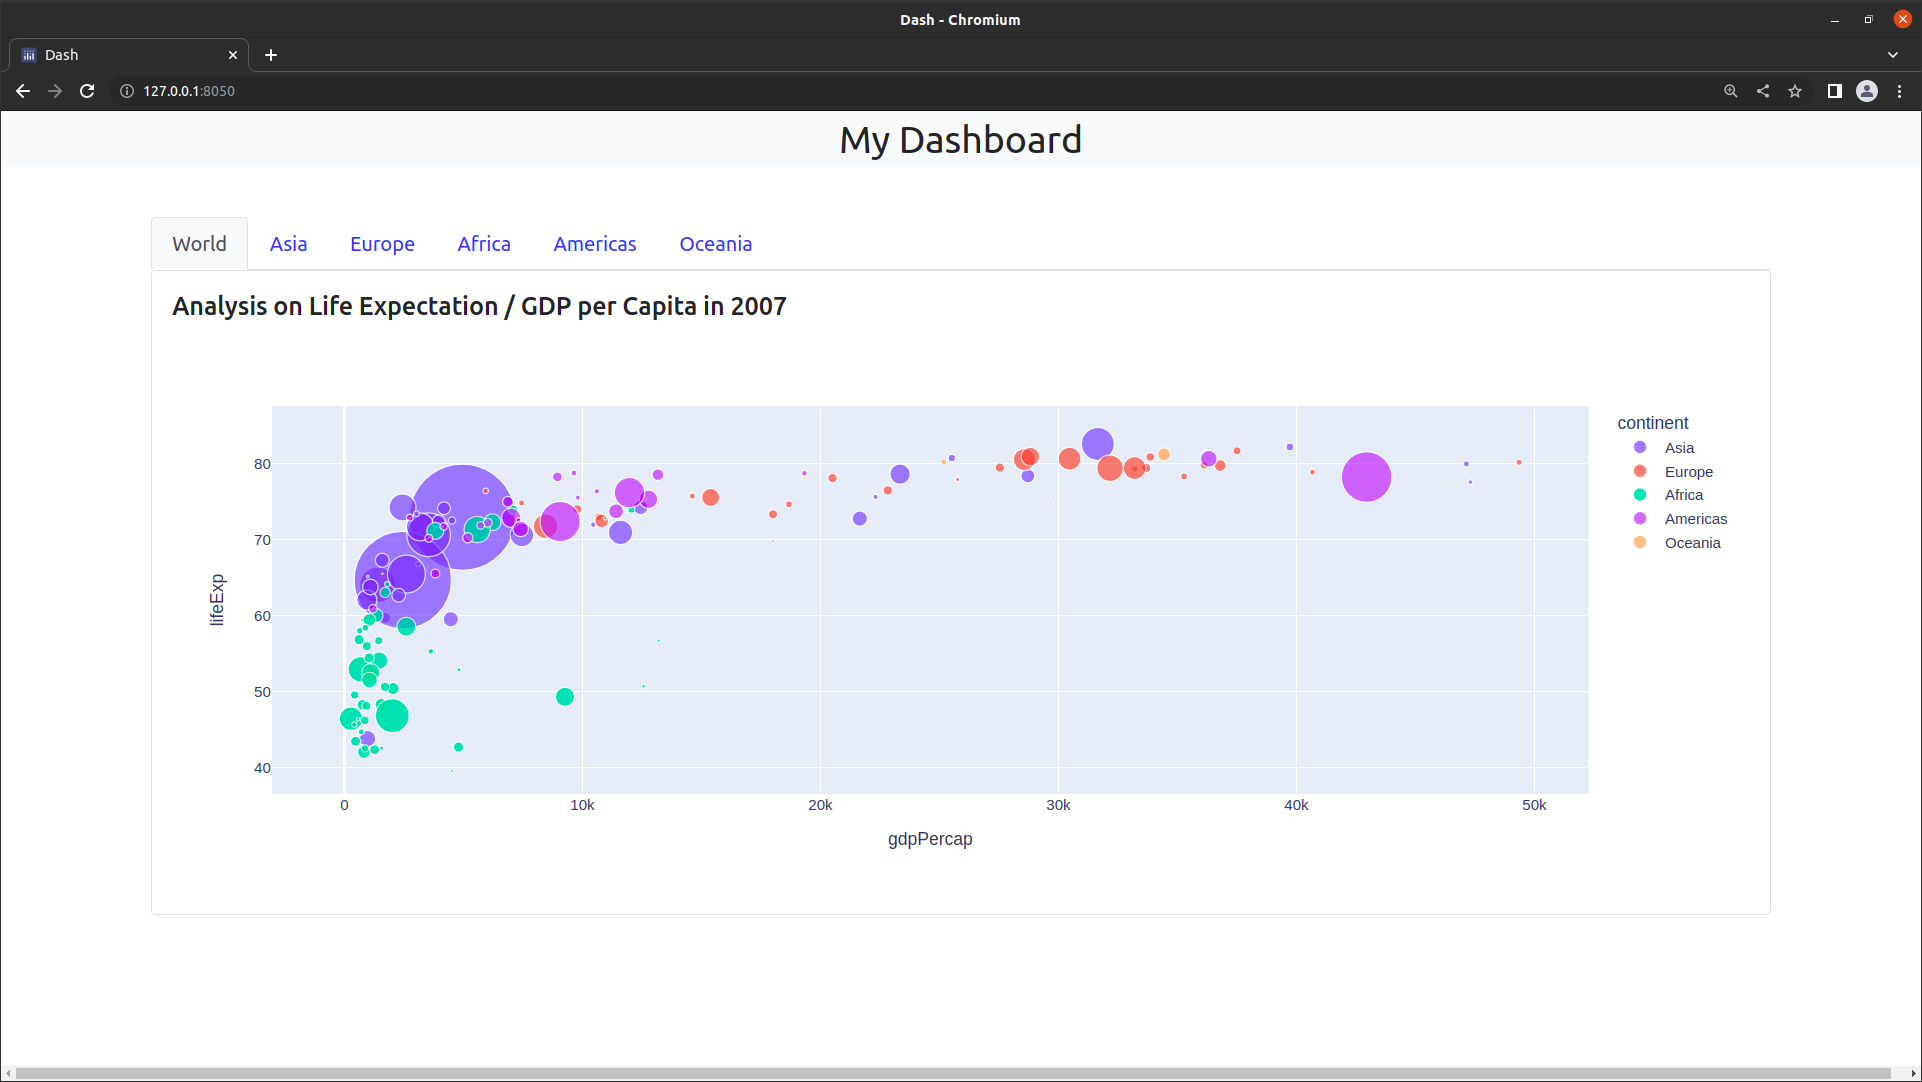
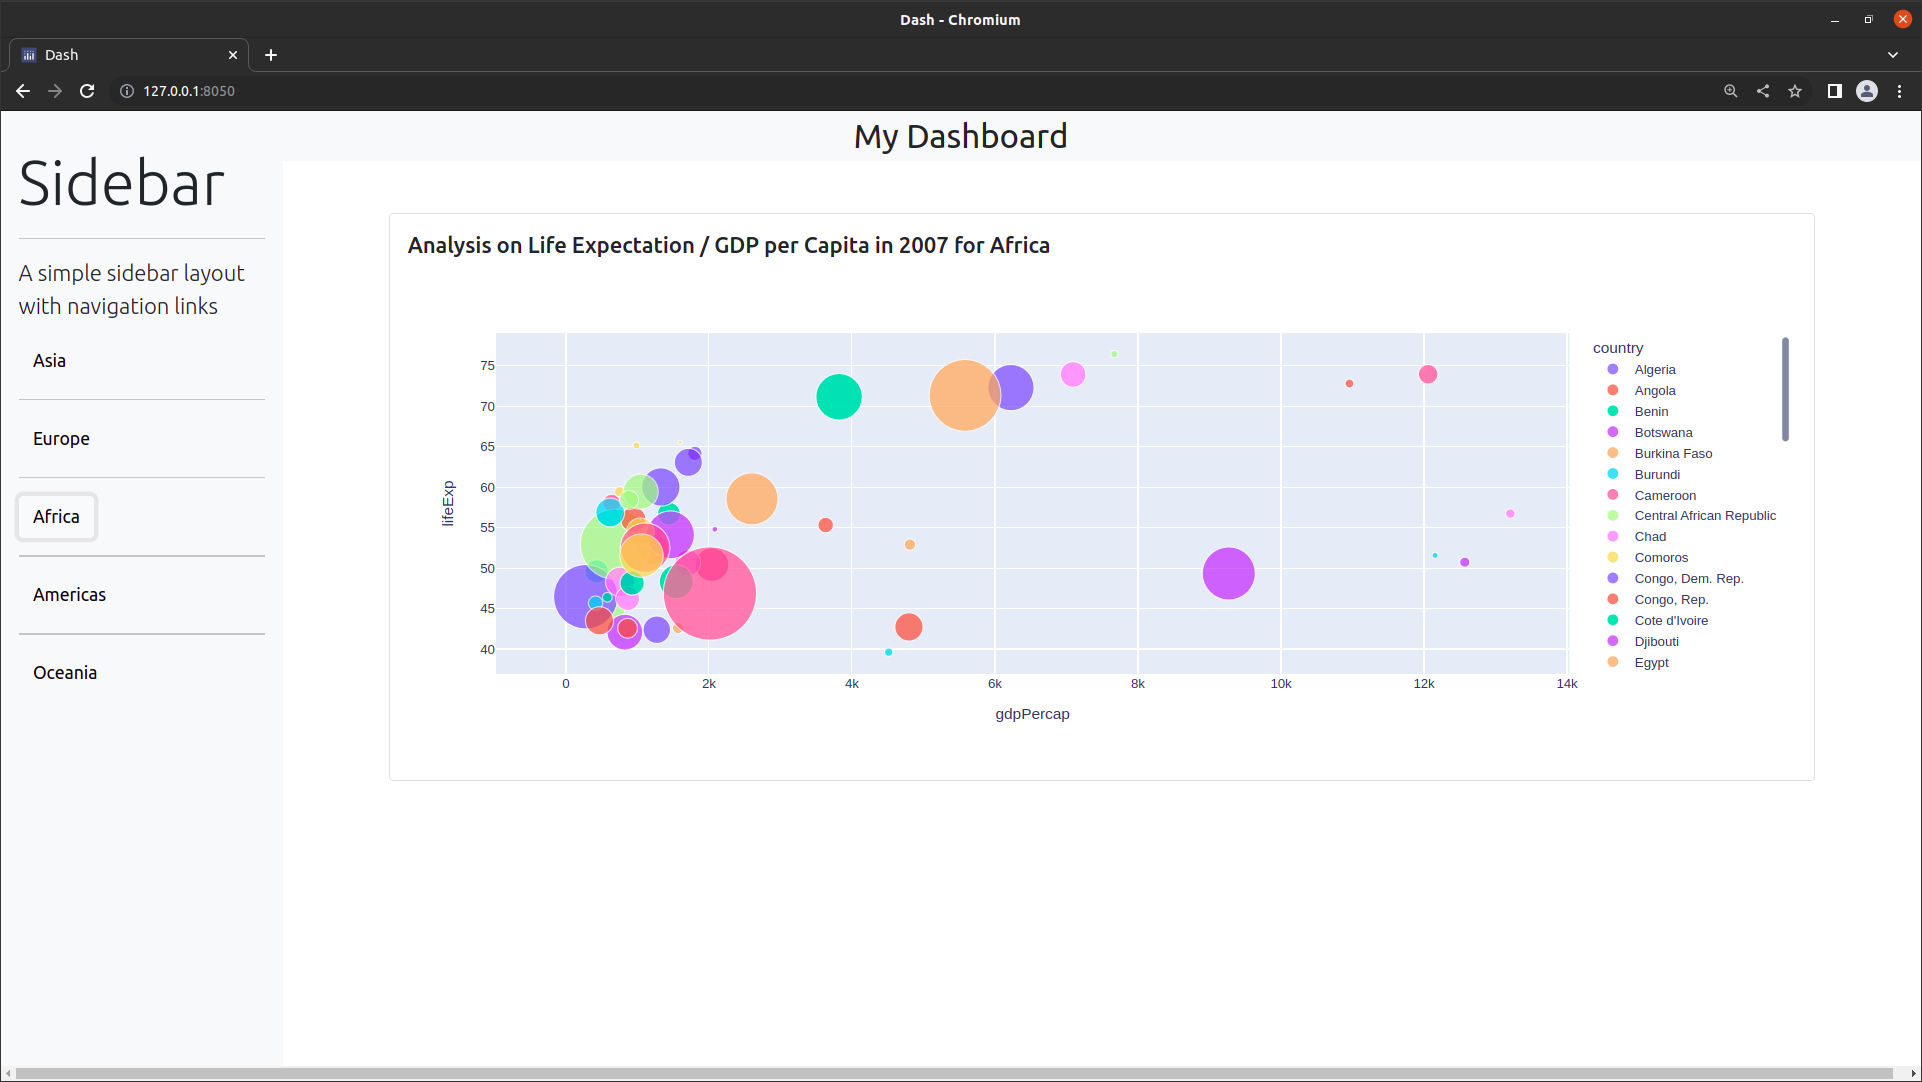
In this section we provide you with a series of layout templates as a blueprint for your own dashboards. For this purpose we omit any unecessary functionality by implementing only the layout without any use of callbacks. We will provide templates that combine control panels and graphs as well as templates that use navigation elements like tabs or a sidebar. Finally, we will restructure these dashboards into multi page apps. We encourage you to use these templates when creating your own dashboards.
Control panels and graphs
This first section gives you two examples that combine control panels with graphs. You will find:
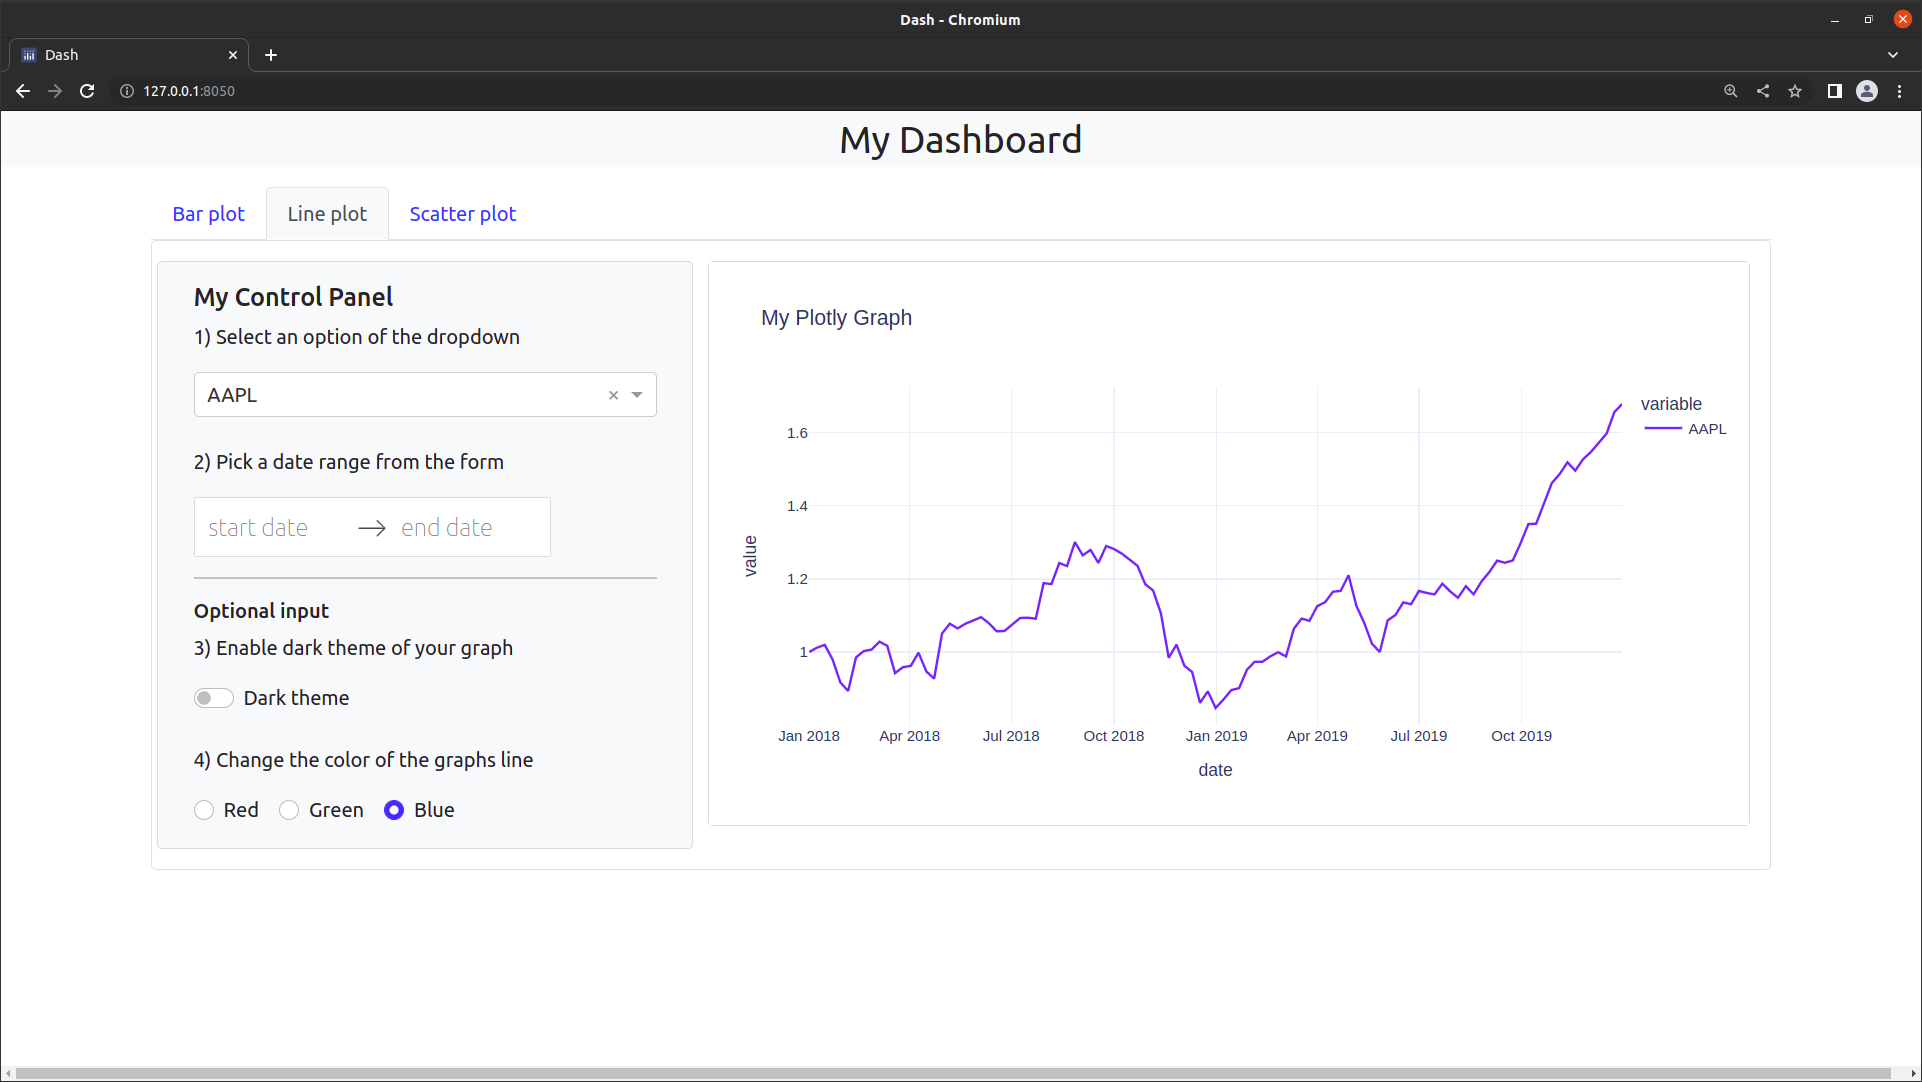
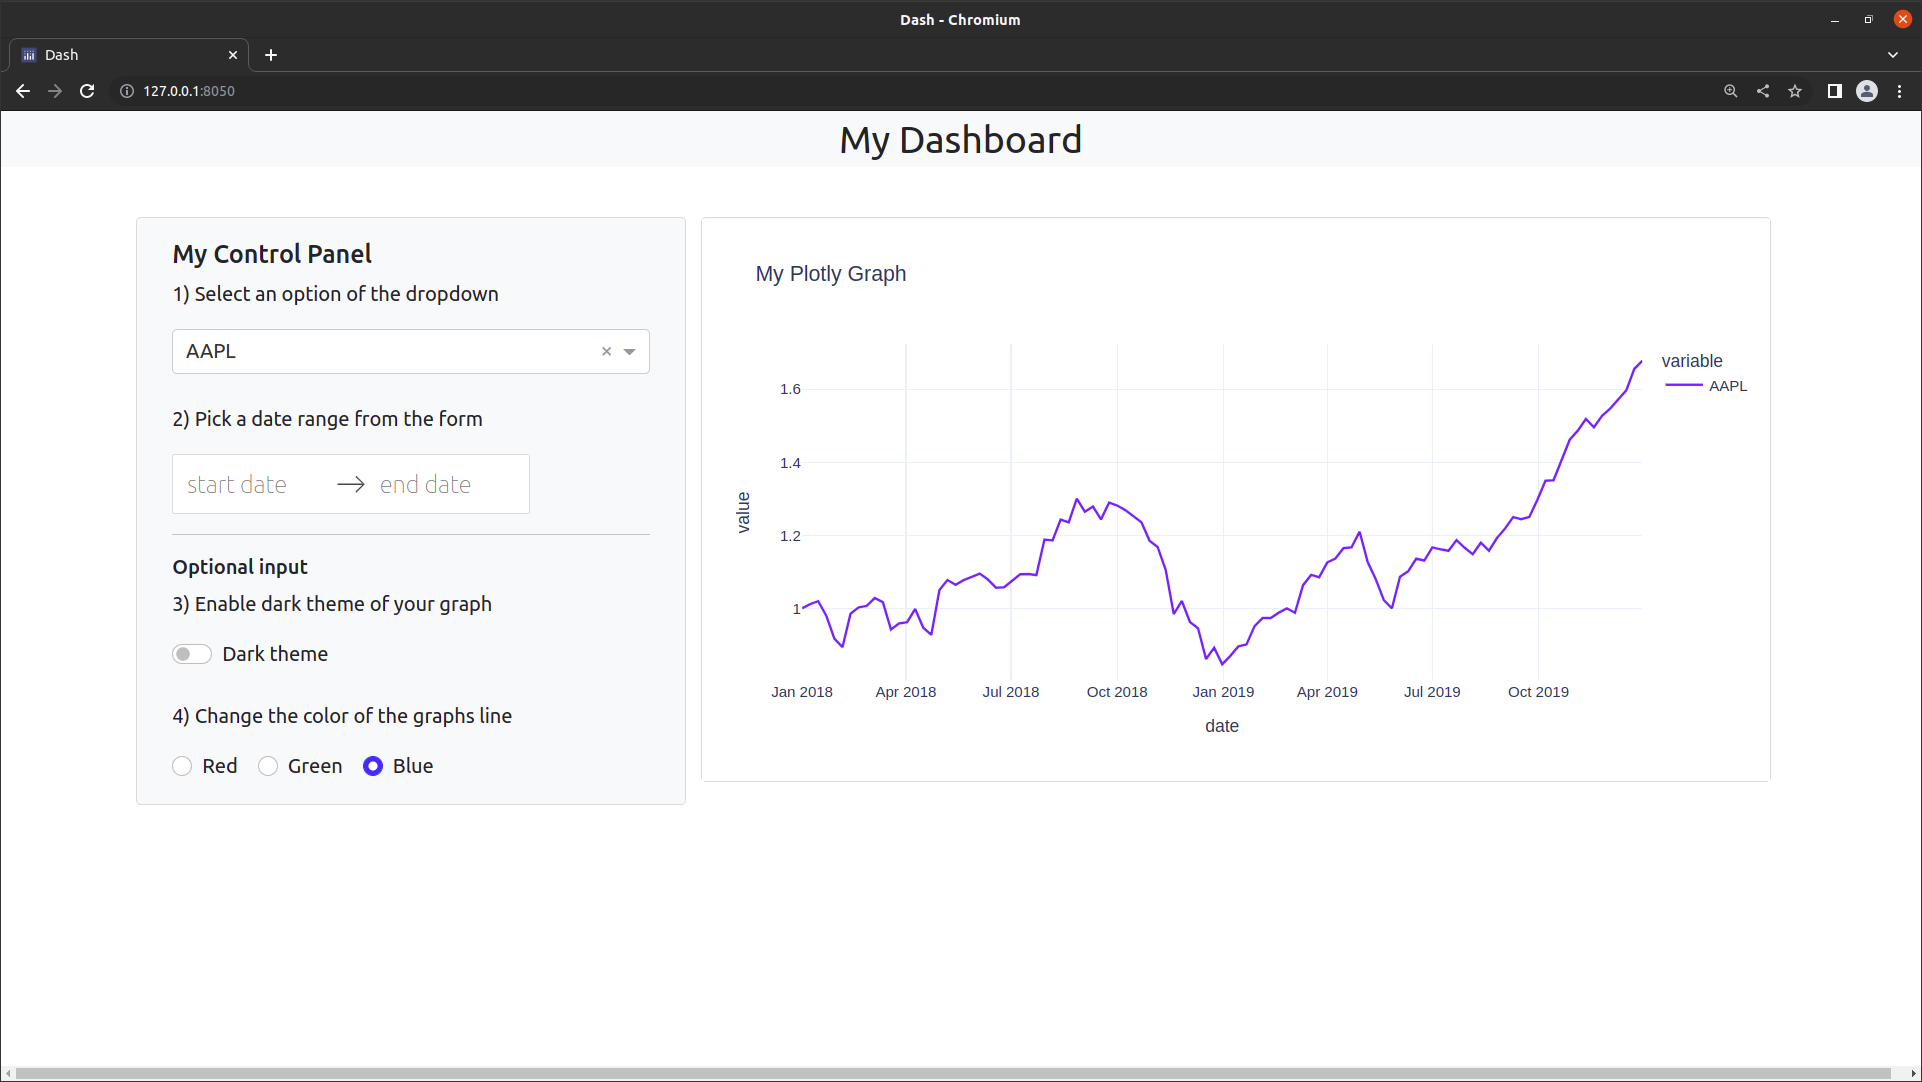
A template with control panel on the left
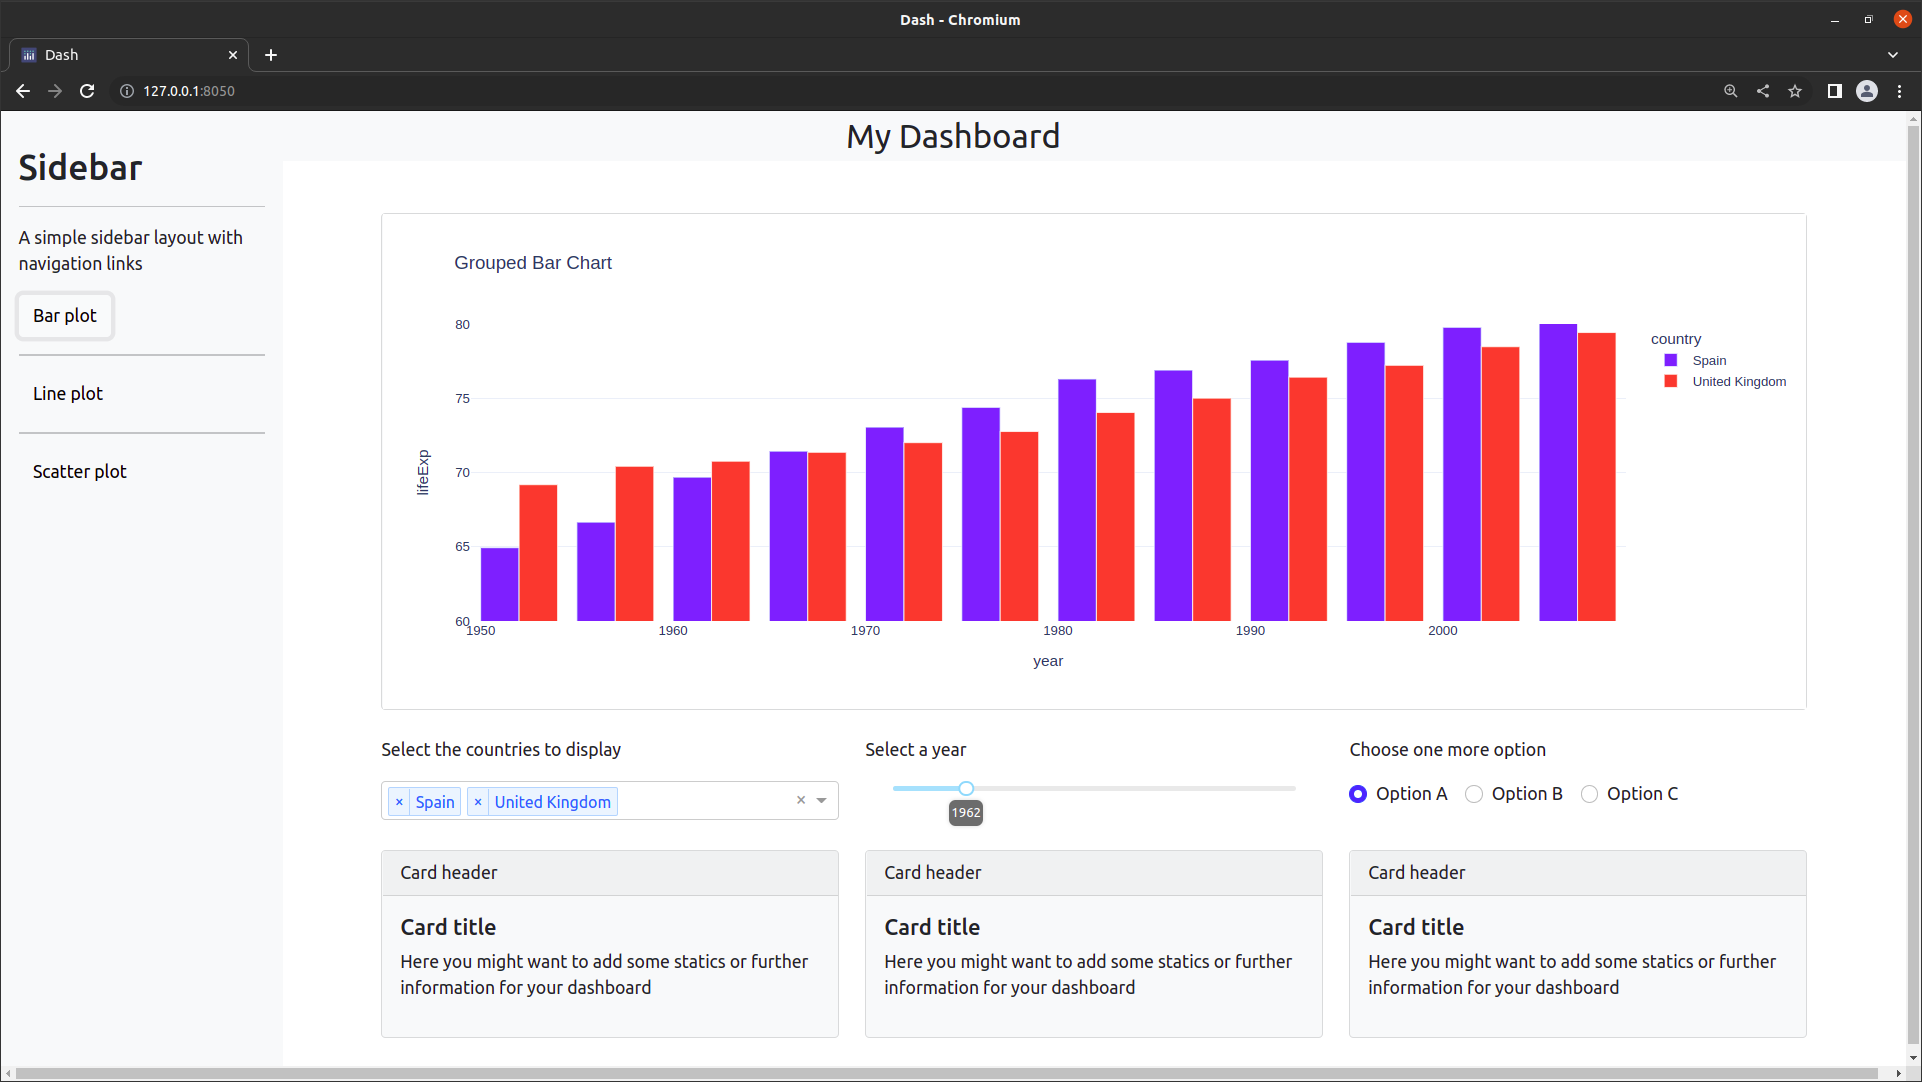
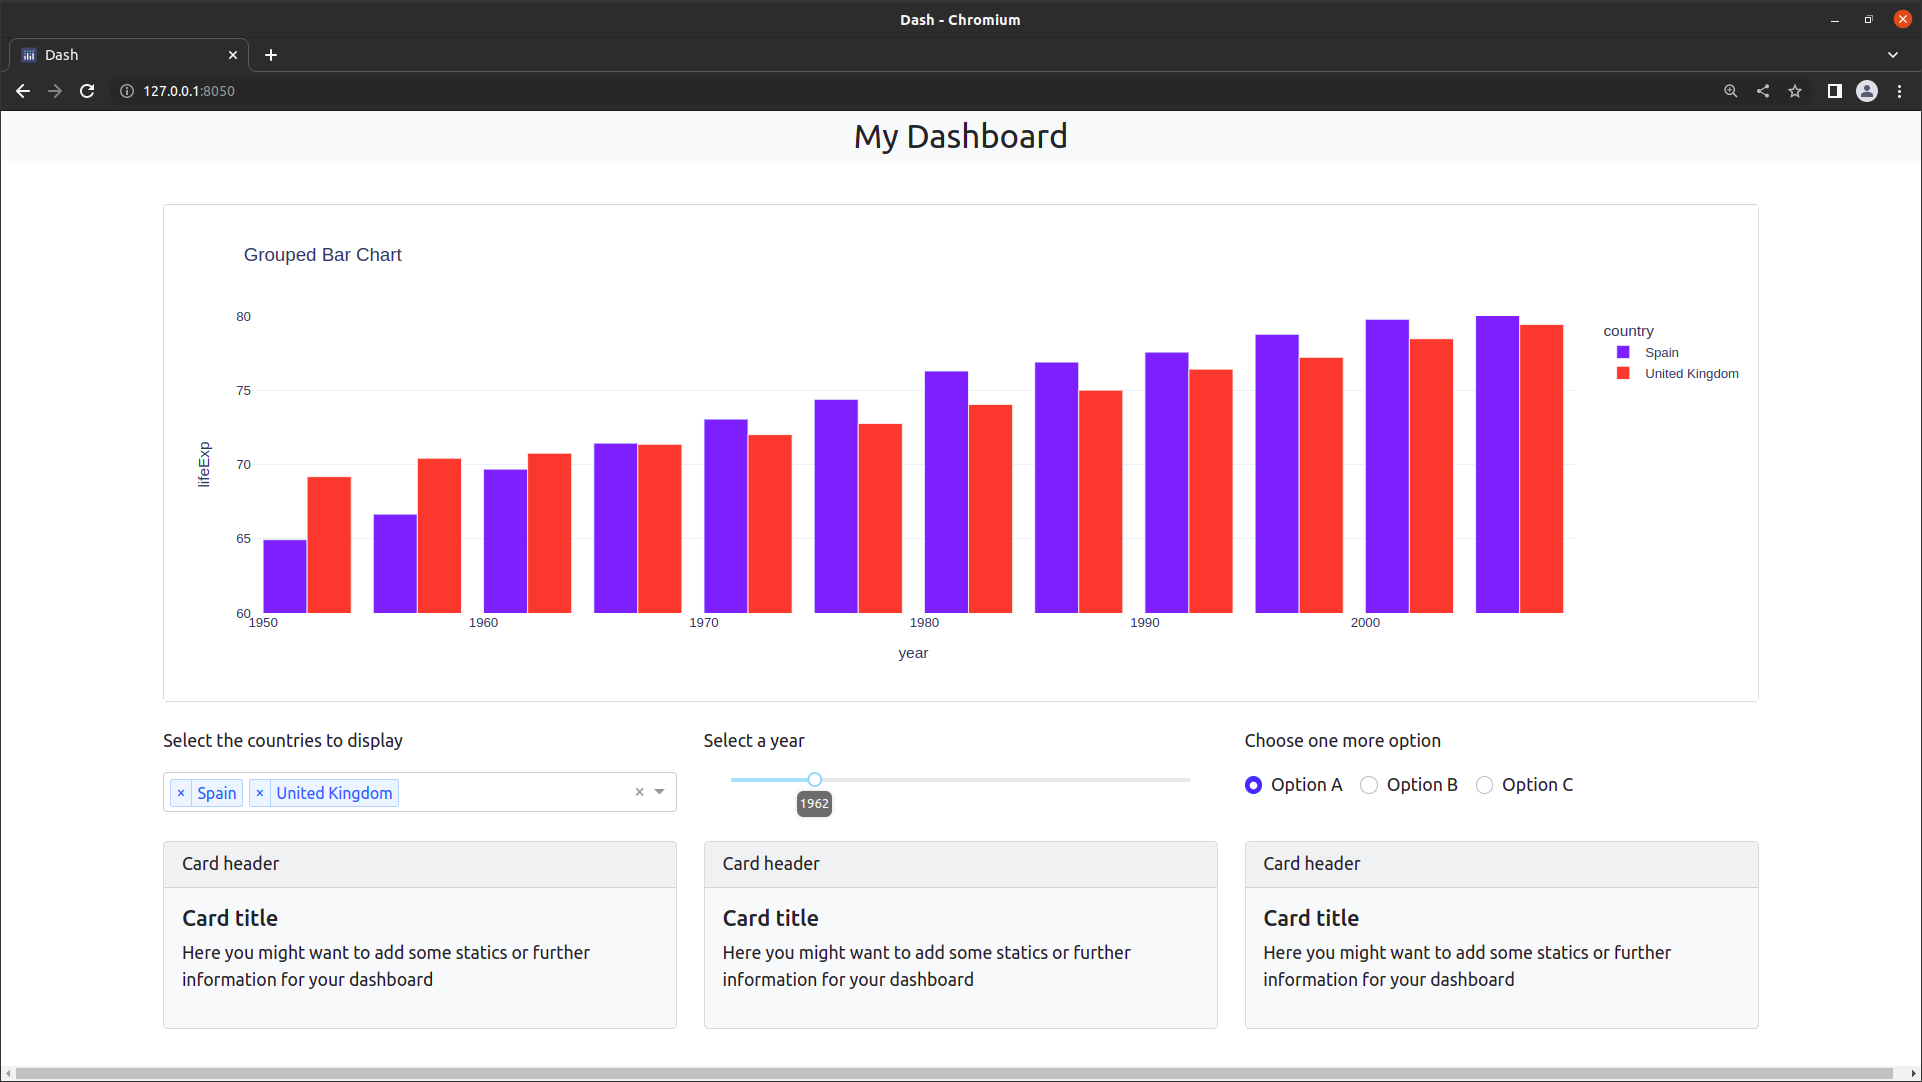
A template with control panel on the bottom
Control panel on the left
See the code
# Import packages
from dash import Dash, dcc, html
import dash_bootstrap_components as dbc
import pandas as pd
import plotly.express as px

# Initialise the App
app = Dash(__name__, external_stylesheets=[dbc.themes.BOOTSTRAP])

# Data
df = px.data.stocks()
df["date"] = pd.to_datetime(df["date"], format="%Y-%m-%d")

# Figure
fig = px.line(
    df, x="date", y=["AAPL"], template="plotly_white", title="My Plotly Graph"
)

# Title
title = dcc.Markdown("My Dashboard", className="bg-light", style={"font-size": 30})

# Dropdown
dropdown = dcc.Dropdown(options=["AAPL", "GOOG", "MSFT"], value="AAPL")

# Date Picker
date_range = dcc.DatePickerRange(
    start_date_placeholder_text="start date",
    end_date_placeholder_text="end date",
    min_date_allowed=df.date.min(),
    max_date_allowed=df.date.max(),
    display_format="DD-MMM-YYYY",
    first_day_of_week=1,
)

# Checklist
checklist = dbc.Checklist(
    options=[{"label": "Dark theme", "value": 1}],
    value=[],
    switch=True,
)

# Radio items
radio_items = dbc.RadioItems(
    options=[
        {"label": "Red", "value": 0},
        {"label": "Green", "value": 1},
        {"label": "Blue", "value": 2},
    ],
    value=2,
    inline=True,
)

# Card content
card_content = [
    dbc.CardBody(
        [
            html.H5("My Control Panel"),
            html.P(
                "1) Select an option of the dropdown",
            ),
            dropdown,
            html.Br(),
            html.P(
                "2) Pick a date range from the form",
            ),
            date_range,
            html.Br(),
            html.Hr(),
            html.H6("Optional input"),
            html.P(
                "3) Enable dark theme of your graph",
            ),
            checklist,
            html.Br(),
            html.P(
                "4) Change the color of the graphs line",
            ),
            radio_items,
        ]
    ),
]

# App Layout
app.layout = html.Div(
    [
        dbc.Row([dbc.Col([title], style={"text-align": "center", "margin": "auto"})]),
        html.Br(),
        dbc.Container(
            [
                dbc.Row(
                    [
                        dbc.Col(
                            [
                                dbc.Row(dbc.Card(card_content, color="light")),
                            ],
                            width=4,
                        ),
                        dbc.Col(
                            dbc.Card(
                                dcc.Graph(id="figure1", figure=fig), color="light"
                            ),
                            width=8,
                        ),
                    ]
                )
            ]
        ),
    ]
)


# Run the App
if __name__ == "__main__":
    app.run_server(debug=False)
Control panel on the bottom
See the code
# Import packages
from dash import Dash, dcc, html
import dash_bootstrap_components as dbc
import plotly.express as px

# Initialise the App
app = Dash(__name__, external_stylesheets=[dbc.themes.BOOTSTRAP])

# Data
df = px.data.gapminder()
df_options = df[df["continent"].isin(["Europe"])]["country"].unique()
df = df[df["country"].isin(["Spain", "United Kingdom"])]

# Figure
fig = px.bar(
    df,
    x="year",
    y="lifeExp",
    color="country",
    barmode="group",
    title="Grouped Bar Chart",
    template="plotly_white",
)
fig.update_yaxes(range=[60, 80])

# Title
title = dcc.Markdown("My Dashboard", className="bg-light", style={"font-size": 30})

# Dropdown
dropdown = dcc.Dropdown(
    options=df_options, value=["Spain", "United Kingdom"], multi=True
)

# Slider
slider = dcc.Slider(
    df["year"].min(),
    df["year"].max(),
    5,
    value=df["year"].min() + 10,
    marks=None,
    tooltip={"placement": "bottom", "always_visible": True},
)

# Radio items
radio_items = dbc.RadioItems(
    options=[
        {"label": "Option A", "value": 0},
        {"label": "Option B", "value": 1},
        {"label": "Option C", "value": 2},
    ],
    value=0,
    inline=True,
)

# Card content
card_content = [
    dbc.CardHeader("Card header"),
    dbc.CardBody(
        [
            html.H5("Card title"),
            html.P(
                "Here you might want to add some statics or further information for your dashboard",
            ),
        ]
    ),
]

# App Layout
app.layout = html.Div(
    [
        dbc.Row([dbc.Col([title], style={"text-align": "center", "margin": "auto"})]),
        html.Br(),
        dbc.Row(
            [
                dbc.Col(
                    [dbc.Card(dcc.Graph(id="figure1", figure=fig), color="light")],
                    width=10,
                    style={"margin": "auto"},
                ),
            ]
        ),
        html.Br(),
        dbc.Row(
            [
                dbc.Col(
                    [
                        dbc.Row(
                            [
                                dbc.Col(
                                    [
                                        html.P("Select the countries to display"),
                                        dropdown,
                                    ]
                                ),
                                dbc.Col(
                                    [
                                        html.P("Select a year"),
                                        slider,
                                    ]
                                ),
                                dbc.Col(
                                    [
                                        html.P("Choose one more option"),
                                        radio_items,
                                    ]
                                ),
                            ]
                        ),
                    ],
                    width=10,
                    style={"margin": "auto"},
                )
            ]
        ),
        html.Br(),
        dbc.Row(
            [
                dbc.Col(
                    [
                        dbc.Row(
                            [
                                dbc.Col([dbc.Card(card_content, color="light")]),
                                dbc.Col([dbc.Card(card_content, color="light")]),
                                dbc.Col([dbc.Card(card_content, color="light")]),
                            ]
                        )
                    ],
                    width=10,
                    style={"margin": "auto"},
                ),
            ]
        ),
    ]
)


# Run the App
if __name__ == "__main__":
    app.run_server(debug=False)
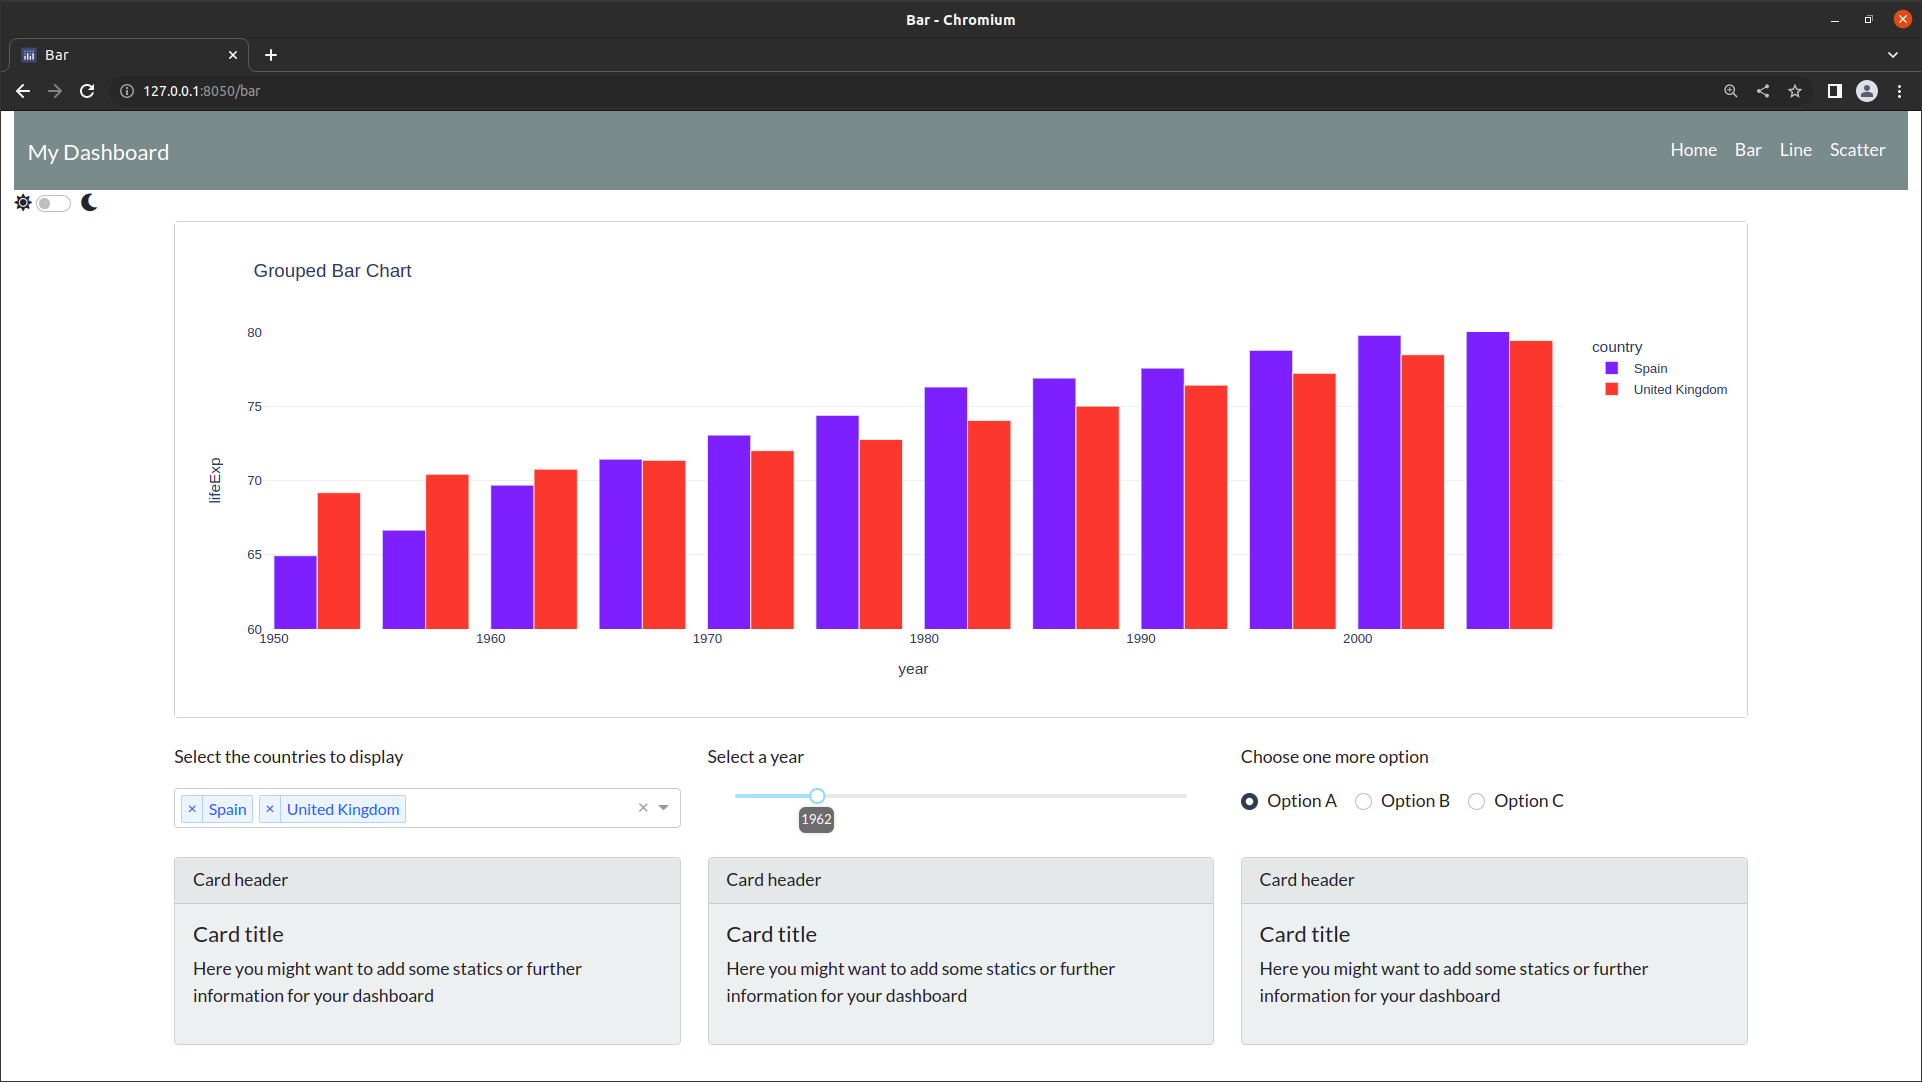
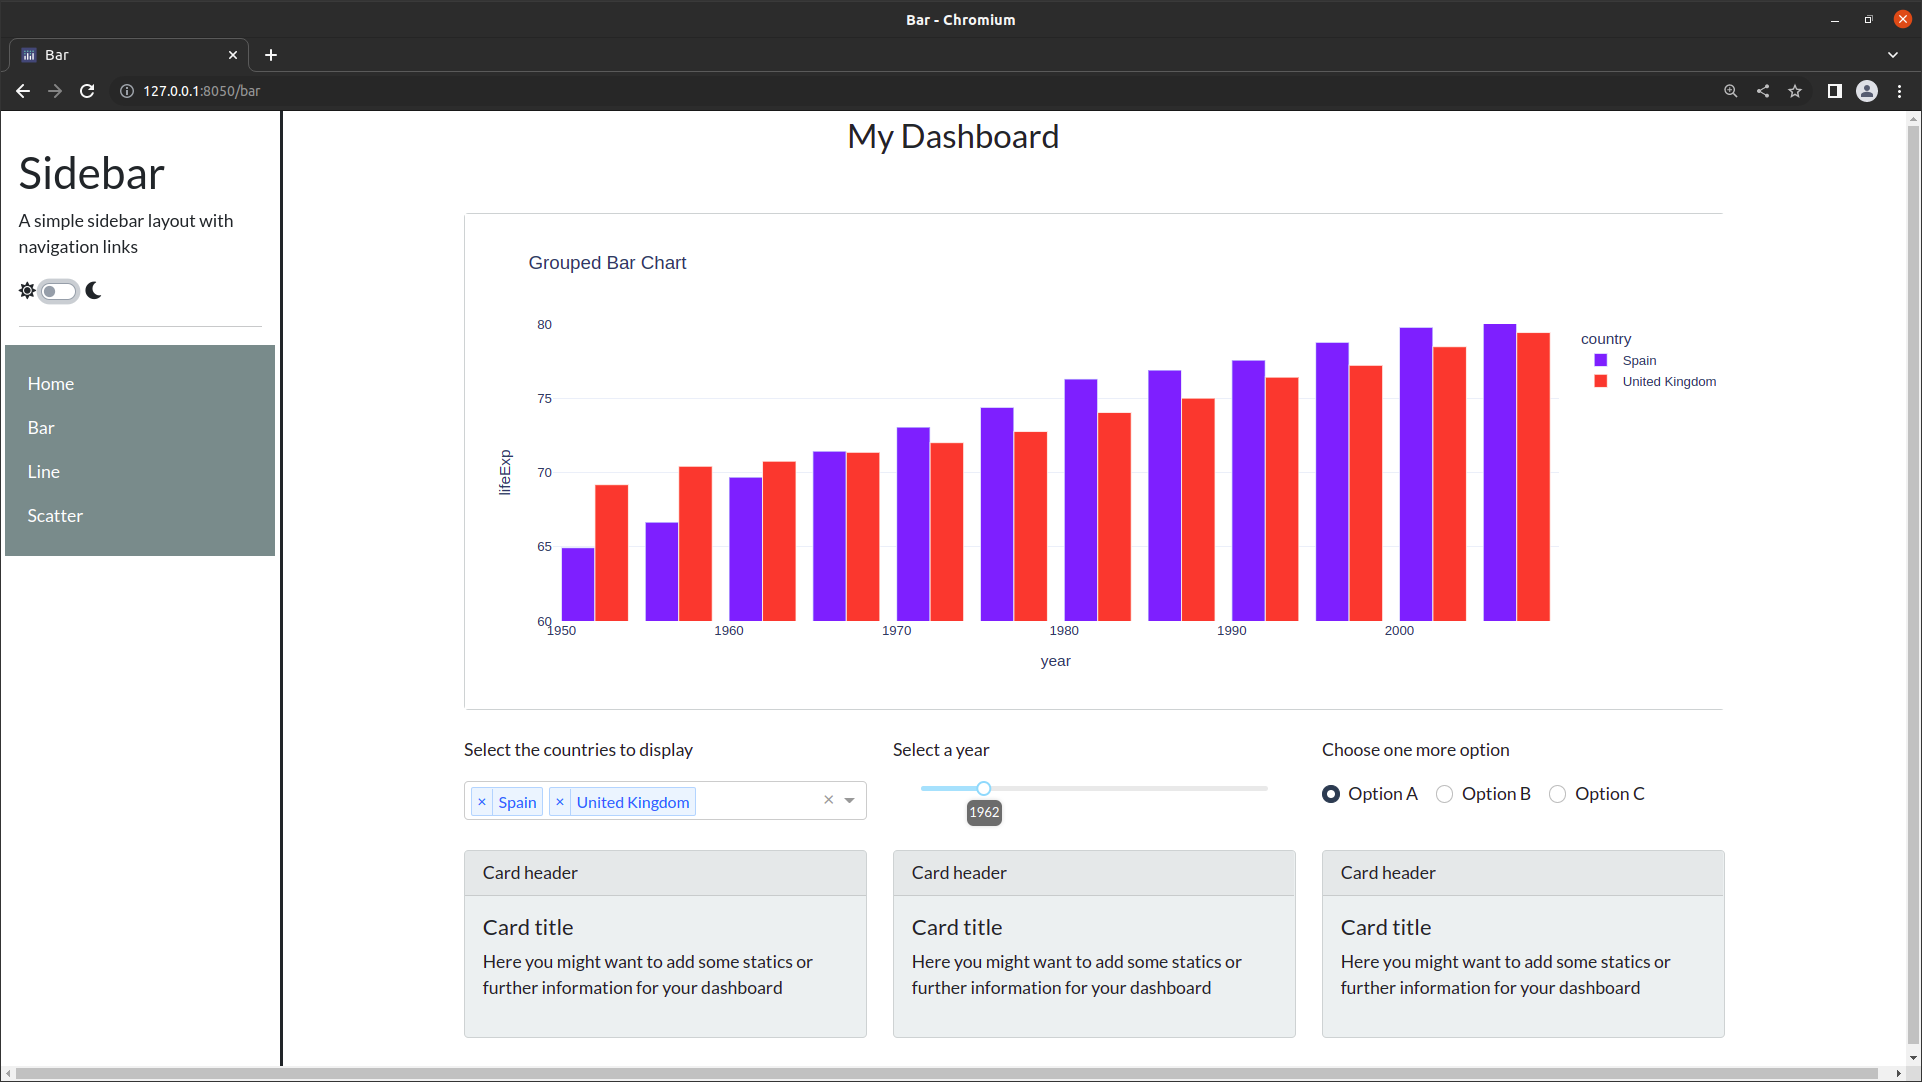
Multipage app
The last section concludes this appendix on dashboard layouts and will wrap everything we have implemented above into a multipage app. Here, you find
A multipage app with navigation bar on the top and
A multipage app with navigation bar on the side
Below each template you find the corresponding code to incorporate into your main app.py file. The other files are the same as for both dashboards, you can download them here.

